Emile Silvis
AI exposure for EU jobs 🇪🇺
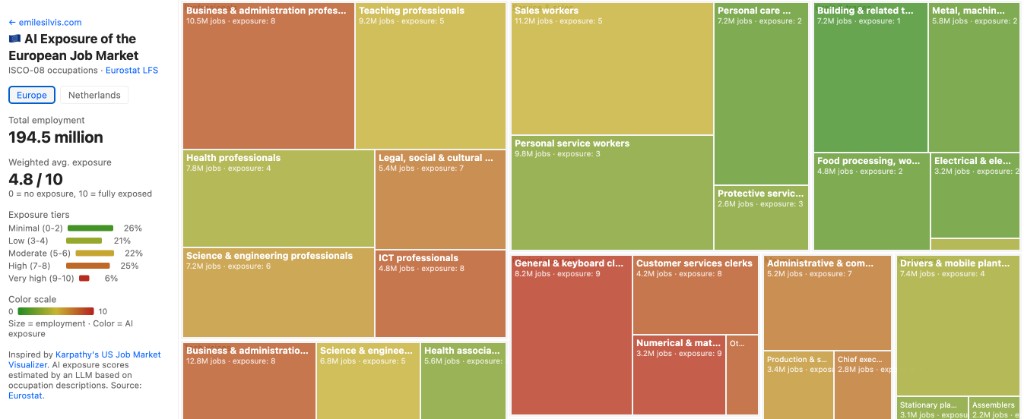
Andrej Karpathy recetly built this for the US. I wanted to see what it looks like for Europe, so I built an interactive treemap for the Netherlands and Europe. Every rectangle is an occupation. Size = employment. Colour = AI exposure (green → red).
I see the same pattern as the US: knowledge work scores high, physical work scores low.
ICT professionals: 9/10. Business & admin professionals: 8/10. Building trades workers: 1/10. Cleaners: 1/10. Average across all European jobs: 4.9/10.
Some surprises though. Science and engineering professionals: 8/10 — is it because they write lots of reports? Health professionals: only 5/10 — someone still has to examine the patient, I guess. Teaching professionals: 6/10 — high for a job that's about being in a room with humans.
What does this mean? Honestly, it's hard to say. High exposure doesn't necessarily mean displacement — it might just mean augmentation. The same uncertainty applies whether you're an ICT professional or a teacher. We're in genuinely uncharted territory, and I don't think anyone has a confident read on how this plays out job by job.
What I do feel confident about is the longer arc. The things this technology could unlock — accelerated scientific discovery, better medicine, more access to expertise — seem genuinely exciting to me. If the history of productivity-shifting technologies is any guide, the disruption is real but so is what comes after. I'm optimistic about where this leads for humanity, even if the transition is messy.
How I built this
A Python script pulls employment numbers from the Eurostat Labour Force Survey (every ISCO-08 2-digit occupation, EU-27 + Netherlands) and feeds them to GPT-4o to estimate each occupation's LLM exposure on a 0-10 scale (meta: using an LLM to rate LLM exposure). The treemap is a single D3.js HTML file (source) that reads the resulting JSON.