Emile Silvis
LLM exposure for EU jobs 🇪🇺
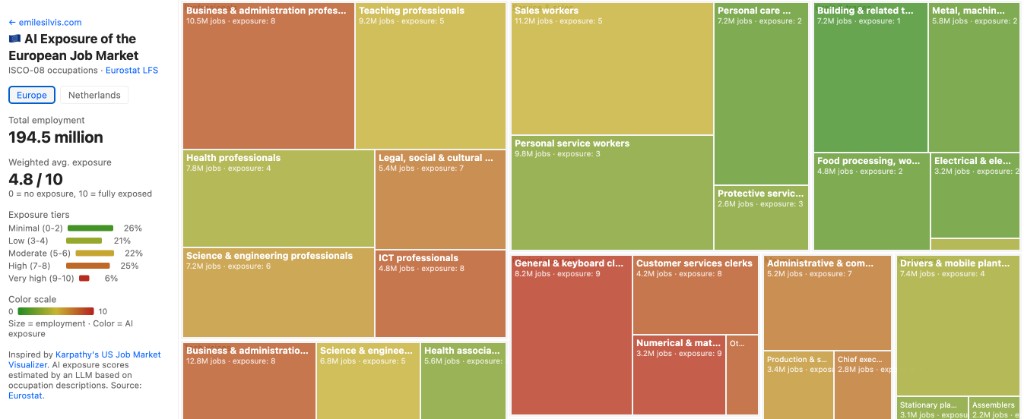
Andrej Karpathy recetly built this for the US. I wanted to see what it looks like for Europe, so I built an interactive treemap for the Netherlands and Europe. Every rectangle is an occupation, with size as the number of people employed in that occumation, and colour is the risk of an occupation to be exposed to AI (green is low, red is high).
I see the same pattern as the US: knowledge work scores high, physical work scores low.
ICT professionals: 9/10. Business & admin professionals: 8/10. Building trades workers: 1/10. Cleaners: 1/10. Average across all European jobs: 4.9/10.
There were some surprises, though. Science and engineering professionals: 8/10 — is it because they write lots of reports? Health professionals: only 5/10 — someone still has to examine the patient, I guess. Teaching professionals: 6/10 — high for a job that's about being in a room with humans.
What does this mean? Honestly, it's hard to say. High exposure doesn't necessarily mean displacement — it might just mean augmentation. We're in uncharted territory, and I don't think anyone can be conident in knowing exactly how all this will play out.
What I do feel confident about is the longer term story. The things that this technology could unlock — accelerated scientific discovery, better medicine, more access to expertise — seem powerful to me. If the history of productivity-shifting technologies is any indication, the disruption is real but so is what comes after. I'm optimistic about what this would mean for humanity, even if the transition is messy.
How I built this
I made a Python script that pulls employment numbers from the Eurostat Labour Force Survey (every ISCO-08 2-digit occupation, EU-27 + Netherlands). This is then fed to an LLM to estimate each occupation's LLM exposure on a 0-10 scale (meta: using an LLM to rate LLM exposure). The treemap is a single D3.js HTML file (source) that reads the JSON resulting from the Python script.